
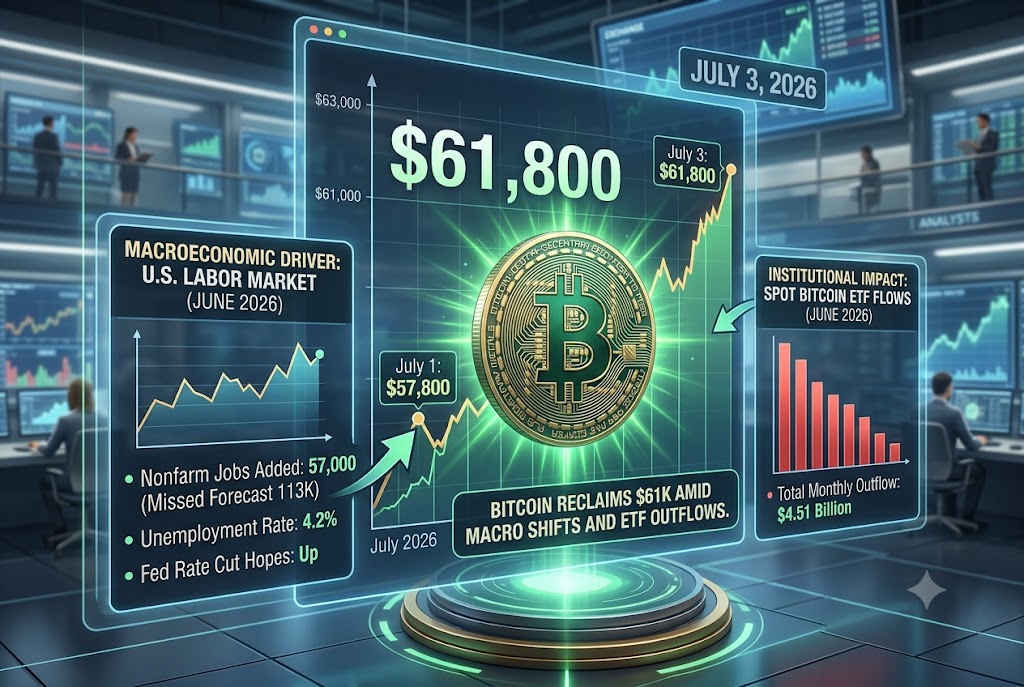
After months of brutal drawdowns from its late-2025 all-time highs of roughly $126,000, Bitcoin (BTC) has finally caught a macroeconomic tailwind. As of July 3, 2026, the apex cryptocurrency is trading securely near the $61,800 mark, staging a sharp 4% rebound from a recent slump that saw it briefly test the $57,800 floor earlier in the week.
What catalyzed this sudden resurgence? The answer lies not in blockchain developments, but in the mechanics of the traditional U.S. labor market.
The Macro Catalyst: Labor Market Weakness
The biggest market mover arrived just before the trading bell on July 2. The U.S. Bureau of Labor Statistics revealed that the economy added a mere 57,000 nonfarm jobs in June—a figure drastically missing the 113,000 to 115,000 forecast and marking the weakest hiring report since the pandemic era. Concurrently, the May figures were revised downward by 43,000, showing that employment had been sputtering longer than initially reported, although the broader unemployment rate managed a slight improvement to 4.2%.
This stark labor slowdown immediately shifted market tone from panic to cautious optimism. Traders are now heavily calculating the odds for the Federal Reserve’s upcoming July 28-29 meeting. Weaker jobs translate directly to reduced pressure for rate hikes—a highly bullish signal for risk assets.
Institutional Headwinds: The ETF Outflow Crisis
Despite the recent price pump, institutional sentiment remains a heavy battleground. June 2026 officially entered the history books as the worst month on record for U.S. spot Bitcoin ETFs, bleeding $4.51 billion in net outflows.
Major institutions are adjusting their outlooks; Citi recently slashed its 12-month ETF inflow forecast to zero. Yet, total ETF assets still hover above a formidable $70 billion. The prevailing market sentiment suggests this massive institutional selling pressure resembles a temporary reallocation pause—driven by profit-taking and capital rotating into AI equities—rather than a complete systemic collapse.
What the Experts Are Saying
To understand the current market architecture, it is essential to look at how leading analysts are interpreting the resistance levels and liquidity flows.
- Macro Correlation: Avinash Shekhar, Co-Founder and CEO of Pi42, noted that Bitcoin’s immediate rebound underscores its deep tether to macroeconomic policy. Shekhar states, “For investors, the conversation is gradually shifting from ‘how low can prices go’ to ‘when does liquidity begin returning to the market.’”
- Technical Resistance: Riya Sehgal, Research Analyst at Delta Exchange, warned that the current momentum is a “relief rally, not a confirmed reversal.” She pinpointed $62,200 as the immediate resistance threshold, noting that a sustained breakout above this level could open the corridor to the $64,000–$65,000 range.
- On-Chain Fundamentals: Mudrex’s Lead Quant Analyst, Akshat Siddhant, pointed out that exchange inflows have spiked above 50,000 BTC per day. Meanwhile, Bitcoin’s MVRV Z-Score has fallen below the +2 standard deviation mark, a historical indicator that valuation premiums are cooling and resetting without plunging into full capitulation territory.
Why is the Bitcoin price going up today?
Bitcoin is rising today primarily due to a worse-than-expected U.S. jobs report for June 2026. The addition of just 57,000 jobs strongly signals a cooling economy, which in turn leads investors to believe the Federal Reserve will back away from restrictive interest rate policies. Lower rates typically drive capital out of safe-haven bonds and back into high-risk, high-reward assets like cryptocurrency.
Will Bitcoin drop back to $53,000 in July?
While current momentum is positive, the market remains highly fragile. Analysts note that if Bitcoin fails to hold the critical $58,000 to $60,000 support zone and drops below the $56,200 floor, it opens the door to a deeper correction toward the $50,000–$53,000 range. However, on-chain metrics—like the Adjusted Sell-side Risk Ratio entering historical accumulation territory—suggest the market is currently building a base, reducing the likelihood of a severe crash.
Sources Quoted: – Avinash Shekhar (Pi42) via The Economic Times
- Riya Sehgal (Delta Exchange) via The Economic Times
- Akshat Siddhant (Mudrex) via The Economic Times
- U.S. labor data & ETF statistics via CoinDesk, CryptoNews, Coinpedia, and Analytics Insight